From Excel Model to Board Deck in 10 Minutes: Data-Linked Slide Automation Explained
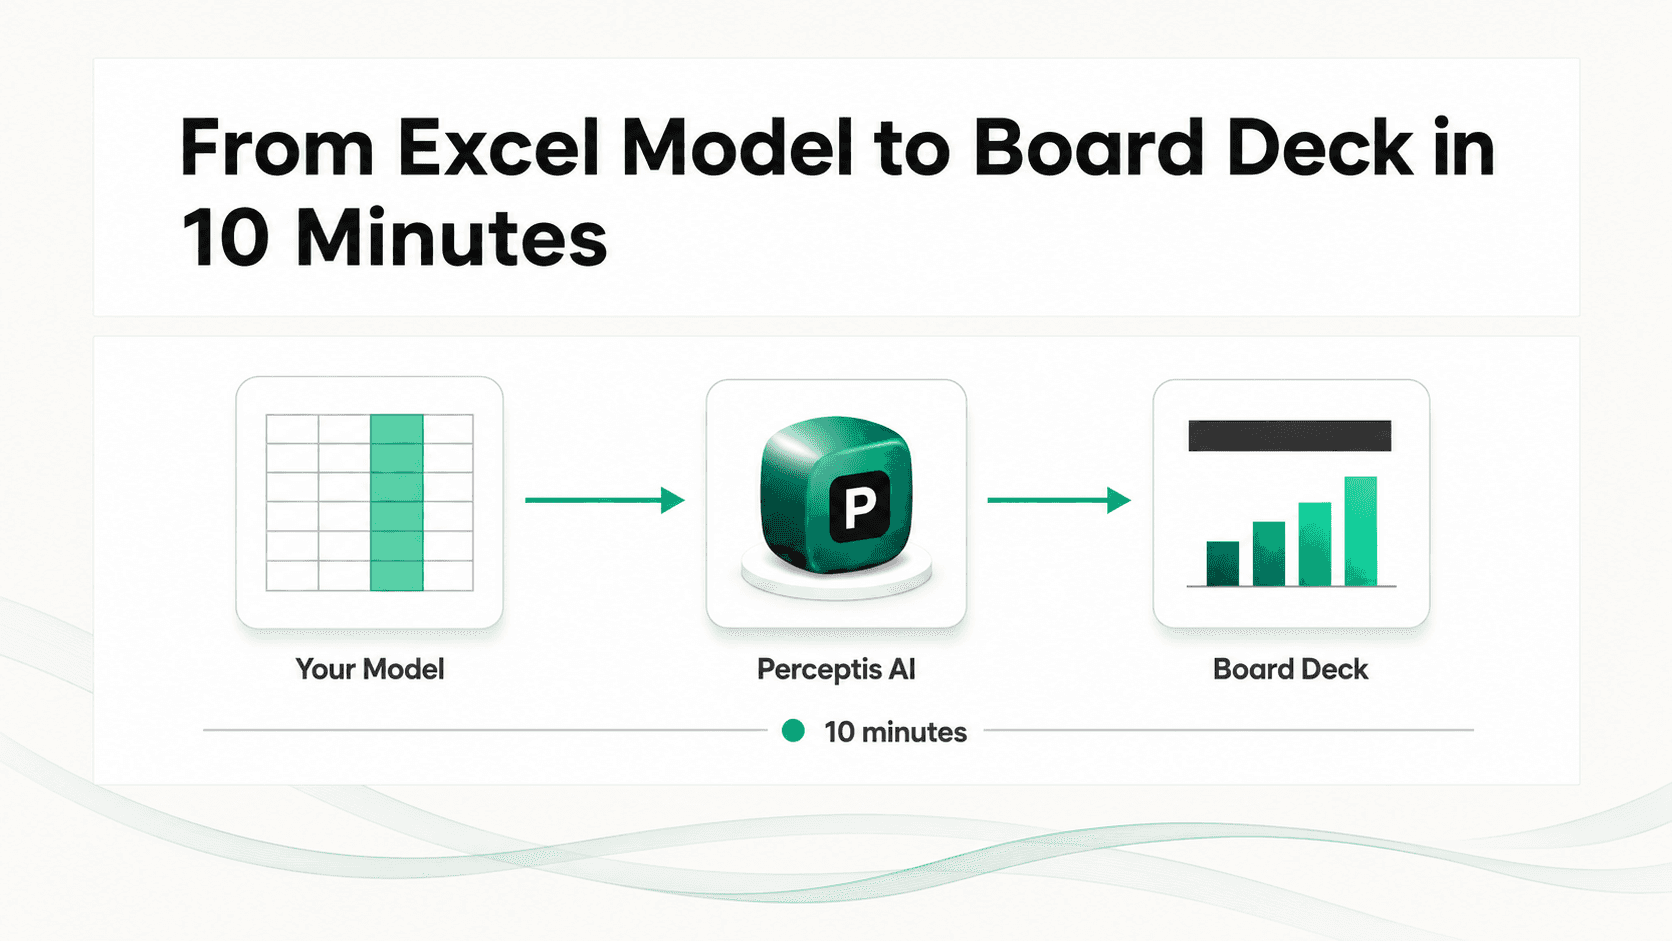
Quick answer: The fastest way to turn an Excel model into a board-ready deck without losing the underlying numbers is to use a tool that outputs native, editable PowerPoint chart and table objects instead of flattened chart images. Perceptis AI does this by generating slides directly into your firm's PowerPoint template, with every chart and table built as a real, editable PowerPoint object you can restyle or update the same way you'd edit any manually built chart. Many general-purpose AI slide tools (Gamma, Beautiful.ai, Pitch, Presentations.ai, and others) export charts as static images once the deck leaves their web editor, which means the moment a number changes in your model, you're rebuilding the slide from scratch. In practice, going from a set of Excel figures to a structured, first-draft board deck takes around 10 minutes with a data-linked workflow, versus the hour or more it typically takes to manually rebuild charts and reformat slides by hand.
See our 10 AI slide generators for consultants compared for how each tool handles native output, and our PowerPoint add-in security comparison if the model you're uploading is client-confidential.
Key takeaways
The difference that matters is native vs. static. A chart built as a real PowerPoint object can be edited, restyled, or updated; a chart exported as an image cannot.
Most AI slide tools flatten charts on export. Perceptis AI's tool-by-tool testing found that Gamma, Beautiful.ai, Pitch, Canva, and Presentations.ai are "export only," while Perceptis, Deckary, Microsoft Copilot, and Plus AI generate native output.
Security matters as much as speed when the source is a financial model. Uploading a real Excel model means checking a tool's data-handling practices before its generation speed.
A fast deck and a defensible deck are different goals. Speed alone doesn't guarantee the resulting numbers survive a partner's or board's questions.
This guide is for consultants, corporate finance teams, and strategy leads who regularly turn a financial model or data extract into a client- or board-facing deck, and want to skip the manual rebuild step without losing control of the underlying numbers.
Why do most AI slide tools break your Excel data?
Most AI presentation tools render charts as flat images once you export the deck, which severs the connection to your underlying numbers.
Web-native AI presentation tools generate their output inside a proprietary browser-based editor. When you export that deck to PowerPoint, the chart is typically converted into a static image or a simplified shape, because the tool's own chart engine doesn't map cleanly onto PowerPoint's native chart objects. According to Perceptis AI's testing across 10 AI slide tools, generators like Gamma, Beautiful.ai, Pitch, Canva, and Presentations AI fall into this "export only" category. The practical effect: if a number in your model changes after the deck is built, you can't just update the chart. You have to rebuild it, or paste in a new image and hope the formatting still lines up.
How does Perceptis turn an Excel model into board-ready slides?
Upload your data, describe the deck you need, and Perceptis builds native PowerPoint charts and tables directly into your firm's template.
The workflow has three steps:
Upload your source material. Bring in your Excel model, a data extract, or a research document. Perceptis reads the figures directly instead of requiring you to manually re-type them into a chart builder.
Describe the deck. Tell Perceptis the audience and the key numbers to feature, or let it build the storyline itself from your source material; either way, Perceptis structures the slides top-down, conclusion first, instead of simply listing your data in the order it appears.
Get a native, editable PowerPoint file. The output lands in your organization's own template, with every chart and table built as a real, editable PowerPoint object instead of a picture of one.
This is available through the web app, the PowerPoint add-in, the API for generating decks at scale, and an MCP connector for agent-driven workflows.
What makes a chart or table "data-linked" instead of a static image?
A data-linked chart is a real PowerPoint chart object with an editable data sheet behind it, built directly from your numbers instead of rendered as a static picture.
When Perceptis generates a chart, it builds an actual PowerPoint chart object, the same kind you'd get by inserting a chart manually and typing in the numbers. That means you can open the chart's data sheet inside PowerPoint and adjust the figures directly, restyle colors and axes using PowerPoint's native chart tools, or hand the file to a colleague who can update it without needing the original tool at all. Tables behave the same way: they're real, editable PowerPoint tables built directly from your data, so there's no screenshot of a spreadsheet sitting on the slide. This is different from a live, auto-refreshing connection back to an external Excel file. It's the difference between a chart you can keep working on and one you have to recreate.
How should you structure a board deck built from a financial model?
A board deck built from a model should lead with the conclusion the numbers support. The numbers themselves come second, as evidence.
Perceptis applies a consulting-style structure to the deck automatically: a top-down argument (conclusion first, evidence second), MECE breakdown of the supporting drivers, and insight-led action titles ("Strategic engagement with five critical stakeholder groups will accelerate adoption and minimize resistance") instead of descriptive labels ("Stakeholder Analysis"). This matters more for a board deck built from a model than for almost any other type of deck, because a board's first question about any chart is usually "so what," rarely just "what."
What are the security considerations when uploading a financial model?
Treat a financial model like any other confidential document: check the tool's data-handling policy before you upload it.
Perceptis is SOC 2 compliant, independently attested by a third-party auditor. Its contractual role is that of a data processor; the customer organization remains the data controller. It doesn't train its models on customer data, isolates each organization's documents from other customers (tenant isolation), and publishes an annually re-reviewed subprocessor list on its Vanta trust portal. Before uploading a real financial model to any AI tool, confirm its current certifications directly instead of assuming they exist.
Native output vs. export-only: how the field compares (2026)
Tool | Chart/table output | Best for | Key limitation |
|---|---|---|---|
Perceptis AI | Native, editable PowerPoint objects in your template | Consultants and finance teams building board- or client-facing decks from real data | Minor cleanup after generation |
Microsoft Copilot for PowerPoint | Native | Microsoft 365 enterprises already on Copilot | Tends toward generic business slides instead of MBB-style structure |
Plus AI | Native (Google Slides and PowerPoint) | Google Workspace teams | Built Google Slides-first; PowerPoint support is functional but less mature |
Deckary | Native (in-app) | In-PowerPoint chart building for specialized chart types | No source-verification layer for the underlying figures |
Gamma / Beautiful AI / Pitch / Canva / Presentations AI | Export only (charts flatten to images) | Fast, web-shared decks for marketing or pitching | Charts and tables must be rebuilt after any data change |
Categorization based on Perceptis's own tool-by-tool testing (June 2026). Confirm current capabilities directly with each vendor, as AI presentation tools update frequently.
How should you choose a workflow for model-to-deck automation?
Start from how often your numbers change after the first draft. That matters more than how fast the first draft looks.
If your model gets revised more than once before the deck ships (which is most real financial and strategy work), prioritize native chart output over generation speed.
If the deck needs to defend a specific number to a partner or board, prioritize source traceability alongside native output.
If the source material is confidential, confirm the tool's SOC 2 status and data-training policy before uploading it.
Pilot the full workflow, model upload through final export, on one real deck before standardizing it across a team.
Frequently asked questions
How do I turn an Excel model into a PowerPoint deck automatically? Upload the model to a tool that generates native PowerPoint chart and table objects instead of one that exports flattened images, describe the argument the deck needs to make, and review the structured draft it produces. Perceptis does this directly into your organization's own template.
Which PowerPoint add-ins support complex business-grade data visualization? Perceptis is built to choose the right visual (chart, table, icon, or diagram) for the specific point on each slide and to output it as a native, editable PowerPoint object. Tools that export charts as flattened images require more manual rebuilding whenever the underlying data changes.
Do AI presentation tools offer secure API access for corporate data? Some do. Perceptis offers an API for generating decks at scale, alongside a PowerPoint add-in and an MCP connector, and is SOC 2 compliant with no training on customer data. Confirm any vendor's current certifications directly before connecting it to a live data pipeline.
Is a data-linked chart the same as a live connection to my Excel file? No. A data-linked chart in this context means a real, editable PowerPoint chart object with its own data sheet, built directly from your numbers. It's not an ongoing, auto-refreshing connection back to an external Excel file.
How long does it take to build a board deck from a financial model? With a native, data-linked workflow, a first-draft structured deck from an existing model typically takes around 10 minutes, versus the much longer manual process of rebuilding charts and reformatting slides by hand. Actual time varies with model complexity and the amount of manual review needed afterward.
Want to try the workflow on a real model? Start with the Perceptis PowerPoint add-in or review the API documentation for building this into an existing pipeline.